Mastering Microsoft Excel for Strategic Insights and Smarter Business Decisions

22-23 Jun, 2026, Concorde Hotel Kuala Lumpur

IPA Training is Registered with

Learn from the Best

Kelvin Ng
Microsoft Office 2016 Master Specialist
Microsoft Certified Trainer

Kelvin Ng Choo Kent is a highly experienced digital arts instructor and master trainer with more than 17 years of experience in the office automation consultation, graphic design, animation and print production arena. He is a graduate of Malaysian Institute of Art (MIA) And holds the distinction of being certified as Adobe Certified Expert (ACE), Microsoft Office 2016 Master Specialist MCP & MCT, Certified practitioner of Neuro-Semantics, Certified practitioner of Neuro-Linguistic programming & Certified practitioner of Hypnosis & Time-Lines.

Microsoft Certification

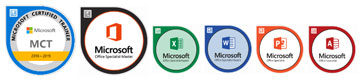
  • MICROSOFT CERTIFIED TRAINER (MCT) SINCE 2012
  • MICROSOFT OFFICE 2016 MASTER SPECIALIST (MOS)
  • MICROSOFT OFFICE EXCEL 2016 SPECIALIST (MOS)
  • MICROSOFT OFFICE WORD 2016 SPECIALIST (MOS)
  • MICROSOFT OFFICE POWERPOINT 2016 SPECIALIST (MOS)
  • MICROSOFT OFFICE ACCESS 2016 SPECIALIST (MOS)

Professional Qualifications

  • PSMB APPROVED TRAINER
  • CERTIFIED ETHICAL HACKER (CEH)
  • ADOBE CERTIFIED EXPERT (ACE)
  • CERTIFIED PRACTITIONER OF NEURO-SEMANTICS
  • CERTIFIED PRACTITIONER OF NEURO-LINGUISTIC PROGRAMMING
  • CERTIFIED PRACTITIONER OF HYPNOSIS & TIME- LINES


AREA OF EXPERTISE
Office Tools
Microsoft Office Suite (2003, 2007, 2010, 2013, 2016), Adobe Acrobat, Microsoft Visio


Soft Skill
Effective Presentation, Train The Trainer, Microsoft Office Business Application Coaching, Effective Communication


Graphic Design

Adobe Photoshop, Adobe Illustrator, Adobe Indesign, Quarkxpress, Adobe Pagemaker, Corel Draw, Corel Photo Paint

His Clientele


Venue Details

Concorde Hotel Kuala Lumpur
2 Jalan Sultan Ismail, 50250 Kuala Lumpur, Malaysia,

https://kualalumpur.concorde hotelsresorts.com/


Contact us

Juliany,
03 2283 6109
juliany@ipa.com.my

Phoebe,
03 2283 6100
phoebe@ipa.com.my 

FOR CUSTOMISED IN-HOUSE TRAINING
Jane,
03 2283 6101
Jane@ipa.com.my

ADDRESS 
A-28-5, 28th Floor, Menara UOA Bangsar, 
No.5, Jalan Bangsar Utama 1, 
59000 Kuala Lumpur
www.ipa.com.my

FOCUSING ON

Data Management & Business Analytics:
• Excel Essentials for Data-Driven Decisions
• Conditional Formatting for Instant Insights
• Tables, Filters & Slicers: Unlocking Business Trends
• Subtotal & Database Functions for Quick Summaries

Advanced Data Analysis & Strategic Insights:
• PivotTables for Data Summarization & Insights
• What-If Analysis for Smarter Decision-Making
• Data Visualization for Persuasive Storytelling
• Final Case Study & Hands-on Project

OVERVIEW

In today’s fast-paced business environment, executives and decision-makers need to rely on data-driven insights to make informed choices. This 2-day intensive course is designed to equip professionals with essential Excel skills for data analysis, reporting, and strategic decision-making. Participants will learn best practices, real-world applications, and advanced tools to transform raw data into actionable intelligence.

AFTER ATTENDING THIS COURSE YOU WILL RETURN TO YOUR JOB…
  1. Mastering essential Excel techniques for effective data handling.
  2. Applying Conditional Formatting to highlight key insights.
  3. Using Tables, Filters, and Slicers to organize and analyze large datasets.
  4. Performing advanced calculations using Subtotal and Database Functions.
  5. Generating interactive PivotTables for deep data analysis.
  6. Applying What-If Analysis for scenario planning and forecasting.
  7. Gaining hands-on experience in creating real- world decision-making models.
WHO SHOULD ATTEND
  • Executives, Managers, and Senior Leaders
  • Business Analysts and Decision Makers
  • Professionals who want to leverage Excel for data-driven decision-making
  • Anyone looking to streamline business reporting and analysis
METHODOLOGY
  • Instructor-Led Training – The trainer will explain key concepts and demonstrate prompt engineering techniques using real examples.
  • Hands-On Practice – Participants will perform guided exercises to apply the prompting techniques using AI tools.
  • Experiential Learning – Participants learn by experimenting with prompts and observing how different prompts influence AI responses.
  • Discussion and Knowledge Sharing – Participants are encouraged to share ideas, experiences,
    and insights during the activities.
  • Group Activities (if time permits) – Participants may work in small groups to solve practical business
    tasks using prompt techniques.
DAY 1
 

DAY 1: DATA MANAGEMENT & BUSINESS ANALYTICS

9:00

EXCEL ESSENTIALS FOR DATA-DRIVEN DECISIONS

  • Structuring data for maximum efficiency
  • Understanding data types and formatting
  • Introduction to data consistency, accuracy, and validation
10.45

CONDITIONAL FORMATTING FOR INSTANT INSIGHTS

  • Using color scales, icon sets, and data bars for quick analysis
  • Creating custom rules to highlight KPIs and outliers
  • Best practices for decision-focused dashboards
1:00 Lunch
2:00

TABLES, FILTERS & SLICERS: UNLOCKING BUSINESS TRENDS

  • Converting datasets into dynamic tables
  • Applying advanced filters and sorting techniques
  • Using Slicers for intuitive filtering in reports
3:45

SUBTOTAL & DATABASE FUNCTIONS FOR QUICK SUMMARIES

  • Automating data aggregation using Subtotal
  • Using DSUM, DCOUNT, DMAX, DMIN for structured database analysis
  • Case Study: Summarizing sales performance for executive reports
5:00 End of Day 1
DAY 2
 

DAY 2: ADVANCED DATA ANALYSIS & STRATEGIC INSIGHTS

9:00

PIVOTTABLES FOR DATA SUMMARIZATION & INSIGHTS

  • Building PivotTables from raw data
  • Analyzing trends and patterns quickly and efficiently
  • Creating interactive reports with Pivot Charts
10.45

WHAT-IF ANALYSIS FOR SMARTER DECISION-MAKING

  • Using Goal Seek for target-driven analysis
  • Exploring Data Tables for sensitivity analysis
  • Creating Scenario Manager reports for executive decision-making
1:00 Lunch
2:00

DATA VISUALIZATION FOR PERSUASIVE STORYTELLING

  • Choosing the right charts for impactful business presentations
  • Using Excel’s advanced visualization tools for clarity
  • Best practices for executive reporting
3:45

FINAL CASE STUDY & HANDS-ON PROJECT

  • Real-world scenario: Analyzing company financials
  • Building an interactive executive dashboard
  • Presenting insights and recommendations
5:00 End of Course